Optimization Example - Maximize SPL
Setting the Optimization Options
Downloading the User Guide Examples: The data for this demonstration are available as getting_started_user_guide.zip. To get results that match the examples, please download and unzip this file before beginning if you haven't already. This example begins with the file getting-started-2.msop.
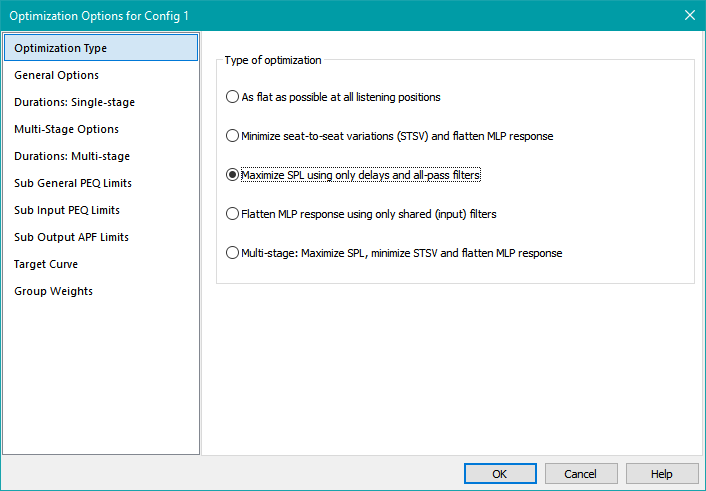
To run an optimization that maximizes SPL, first launch the Optimization Options property sheet using the method described earlier. The Optimization Type property page will initially be displayed.
Specifying the Optimization Type
Choose the Maximize SPL using only delays and all-pass filters option as shown below.
Setting the General Options
Next, select General Options on the left. This will activate the General Options property page shown below.
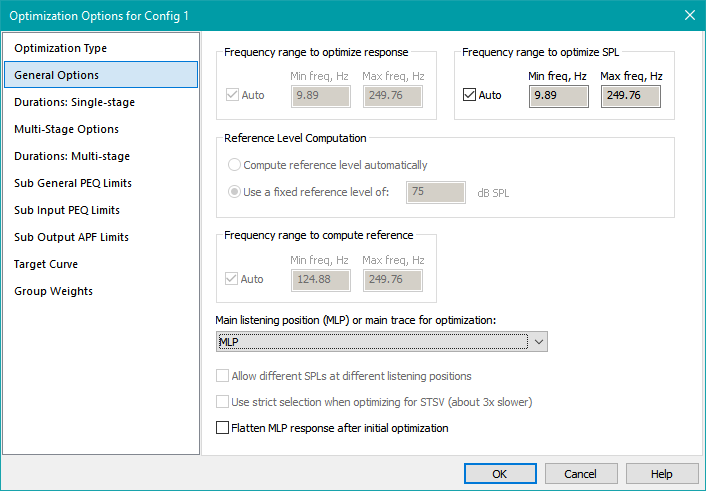
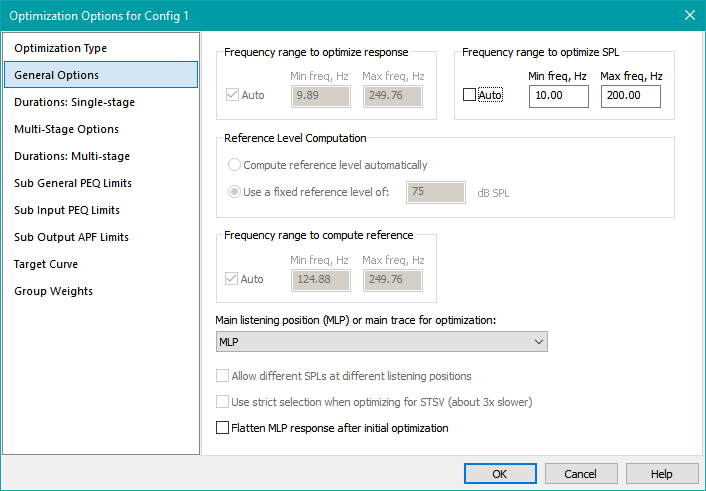
The Frequency range to optimize SPL controls default to Auto, which uses the full frequency range of the data by default. Uncheck Auto and specify a range from 10 Hz to 200 Hz. After the change, it will look as below.
Notice that many controls on this property page are disabled when you choose to optimize only SPL. Frequency range to optimize response and Reference Level Computation are not used in this mode.
Over What Frequency Range Should SPL be Maximized?
This is an interesting question. In versions of MSO prior to v2, optimization was concerned only with different types of frequency response. When one wishes to flatten frequency response using EQ, it's wise to do so only in the usable frequency range of the subs. If you try to flatten sub response at very low frequencies where the response without EQ has already dropped off significantly, you'll get bad results due to too much low-frequency boost. The minimum frequency for equalization needs to be chosen high enough to prevent this. A similar situation exists at the high end of the frequency band.
But SPL maximization is only concerned with keeping the subs acoustically in phase with each other over the listening area. This has benefits over the entire frequency range from about 10 Hz to 200 Hz. At the lowest frequencies, you get maximized output. At the highest frequencies, good phase relationships will prevent deep frequency response dips. The latter situation means any EQ used at the higher frequencies doesn't have to work as hard.
Emphasizing Low Frequencies in SPL Maximization
There has been some concern expressed about weighting MSO's SPL maximization results more toward low frequencies than high. This would be to emphasize low-frequency output capability in preference to higher-frequency behavior. Since MSO's inception, it has altered the optimization frequency sequence from that of the imported measurement data. It generates a frequency sequence with a geometric progression. The number of points per octave (PPO) is constant with frequency, having a nominal value of 96 PPO. In contrast, the measurement data imported form REW has uniform frequency spacing. Having a constant PPO in the frequency spacing means the number of optimization frequency points from 10 Hz to 20 Hz is the same as from 100 Hz to 200 Hz. Because the frequency sampling becomes more and more dense at low frequencies, when RMS values of SPL penalty are computed over frequency, the SPL penalty implicitly emphasizes the low frequencies.
Choosing the Optimization Duration
Choose Durations: single-stage on the left. Under SPL Maximization Duration, choose Specify as a count of and keep the default value shown. If the current value does not match the one shown, press the Reset button on the right to reset its value to the default. The result should look as below.
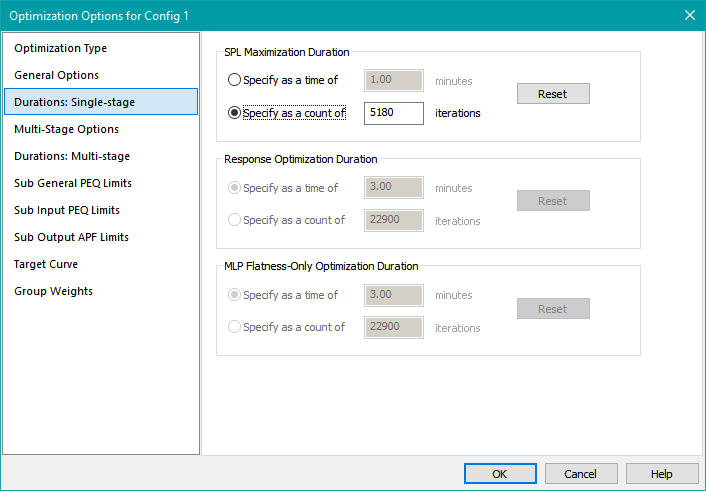
Choosing the duration as a count of iterations will yield similar results on all machines. Slower machines, and machines that support fewer concurrent threads, will take longer.
Specifying All-Pass Filter Parameter Limits
Choose Sub Output APF Limits on the left. That will show the associated property page as below.
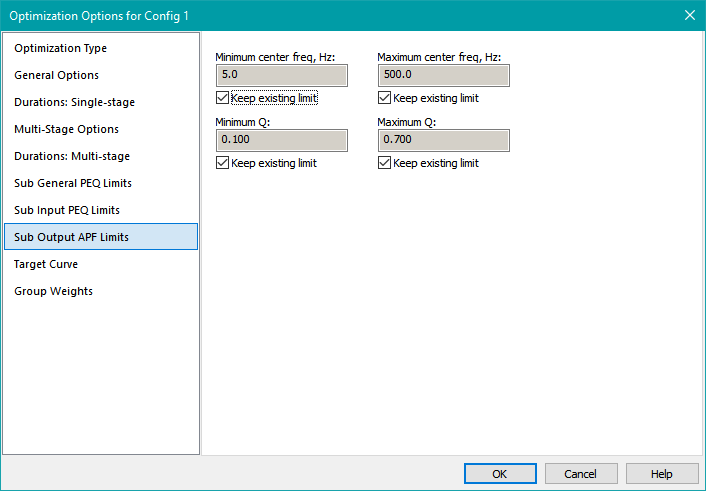
To change any of these limits, uncheck Keep existing limit. This will enable you to enter the parameter limit values you want to use. The default limits shown were chosen based on user experience. These should work well, so keep them as-is and press OK to accept all the options you've entered and close the Optimization Options property sheet.
Checking Performance Metrics Before Optimization
To see how the optimization affects certain performance metrics, we can look at various errors using the Configuration Performance Metrics dialog. To launch it, right-click on the configuration in the Config View, then choose Performance Metrics from the context menu.
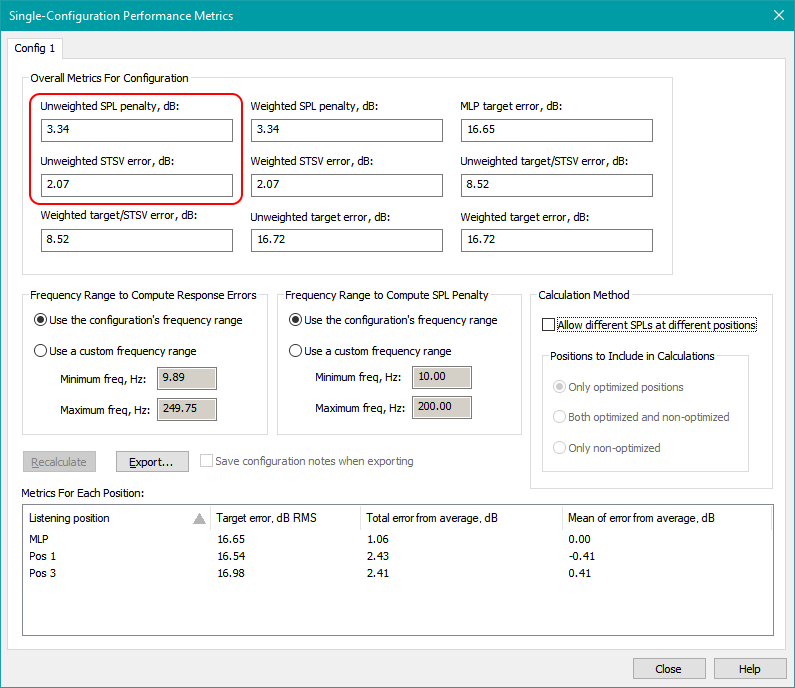
The metrics we'll look at are the marked in red. These are the seat-to-seat variation in dB (STSV), and the SPL penalty. However, when setting the various options for SPL maximization on the General Options property page, the controls didn't allow us to set the frequency range for optimizing STSV. That's because that frequency range is not used when optimizing SPL. When the Configuration Performance Metrics dialog is launched, it just uses the current default for this frequency range when it computes STSV. That default in the absence of any user input is the full range of the imported data. But that range is too wide: in this case 9.89 Hz to 249.76 Hz. On the low-frequency end, the subs' responses are way down, while at the high-frequency end, the results appear chaotic. Let's pick a custom frequency range that's more realistic to compute STSV.
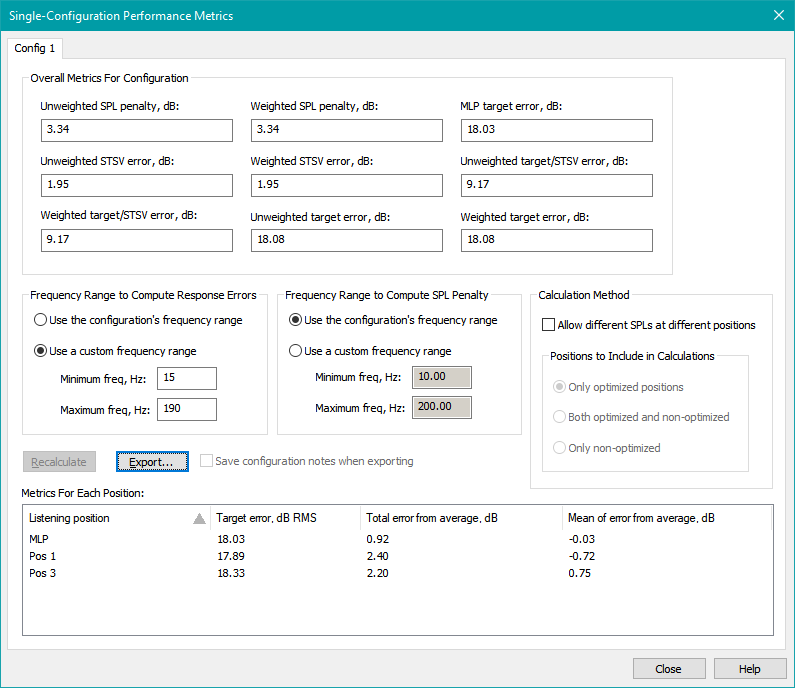
In the Frequency Range to Compute Response Errors group box, click the Use a custom frequency range radio button. Enter 15 in the Minimum freq, Hz edit control and 190 in the Maximum freq, Hz edit control. Press the Recalculate button. The dialog should look as below.

The results from the Performance Metrics dialog before optimization are shown below.
Errors before optimization:
SPL penalty: 3.34 dB
STSV: 1.95 dB
MLP target error: 18.03 dB
Before optimizing, save this file as user-guide-1.msop.
Running the Optimization
Now we'll run the optimization. Right-click on the configuration in the Config View, then choose Optimize Configuration. When the optimization completes, choose the option to accept its results by clicking Yes in the message box. Save this file as user-guide-2.msop.
Results may vary from one optimization run to the next. After running the optimization, open up the Configuration Performance Metrics dialog again, and set the custom frequency range for the STSV calculation to be from 15 Hz to 190 Hz as you did before.
The results from the Performance Metrics dialog after one particular optimization run for the two parameters above are shown below.
Errors after optimization:
SPL penalty: 1.84 dB
STSV: 1.98 dB
MLP target error: 18.99 dB
The SPL penalty has improved, but the STSV is just a tiny bit worse. The SPL improvement is not dramatic, but the baseline SPL penalty was already low, because we started with a system that already had equal gain magnitudes at all frequencies in all DSP channels prior to optimization.
Let's also compare the results by looking at graphs of the before and after conditions. Before optimizing for SPL the response graph looked like this.
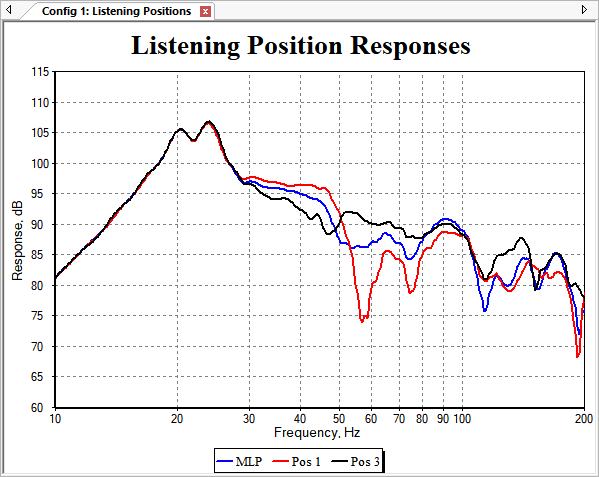
After optimizing, the response graph looks like the one below. These results are in the user-guide-2.msop project found in the getting_started_user_guide.zip file.
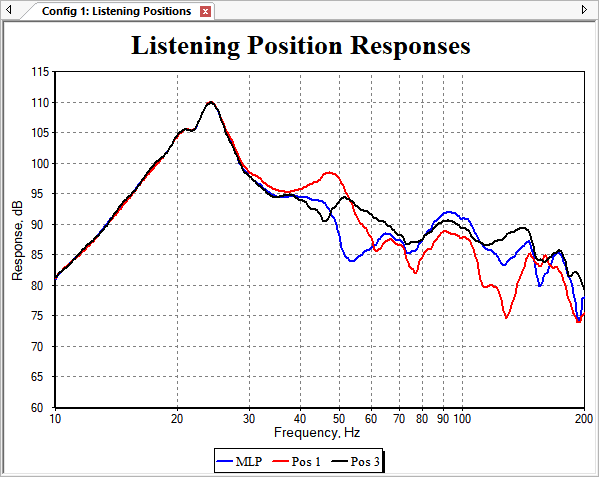
Between 20 Hz and 30 Hz, the output has increased by a little more than 3 dB, reaching 110 dB SPL now. Between 50 Hz and 60 Hz, the large response dip at Pos 1 has gone away. But there is a new dip at around 130 Hz at the Pos 1 position.
One important piece of information that this optimization reveals is that the value of the best SPL penalty that can be expected from this system with two all-pass filters per sub is close to 1.8 dB. Of course, the frequency response isn't even close to flat. Recall from previous discussion that if we were to flatten the MLP frequency response using only shared (input) filters, that won't affect the SPL penalty at all. Let's try this to see what the results look like.
Some Notes About SPL Maximization
-
The SPL penalty computed by MSO only holds for a fixed set of sub positions. It tries to maximize SPL for that particular set of sub positions. If you relocate any subs, the SPL penalty of the new set of sub positions should not be compared with the SPL penalty of any other set of sub positions. SPL maximization only gives a "best for that set of sub positions" result.
- For instance, if you move all your subs into corners and run a new optimization to maximize SPL, a higher SPL penalty with that configuration could have a higher SPL capability than a configuration with all the subs at wall midpoints having a lower SPL penalty.
- You should not run an SPL optimization on a Double Bass Array (DBA) system. A DBA system depends on having the rear subs in opposite polarity with the front ones. It deliberately sacrifices SPL capability in order to optimize the uniformity of the sound field over position in the modal frequency region (which it does very effectively). MSO's SPL optimization will likely interfere with the proper operation of a DBA.