Verifying MSO Predictions
The Importance of Final Verification by Measurement
Because of the nature of MSO's calculations, the accuracy of its predicted results is sensitive to certain types of measurement inaccuracy that have no effect at all on the prediction accuracy of conventional equalization software.
For instance, with REW, its equalization is based only on a single measurement of magnitude response. But MSO must process many measurements and add the processed results together, properly taking phase into account. This technique, called the superposition principle, requires that the relative acoustic phase of the sound waves reaching the measurement microphone from different subs be accurately represented in the measurements themselves. This requires a timing reference.
Earlier discussions contained warnings about what kind of errors can occur, how to use the two-sub timing reference test to verify the integrity of your timing reference before taking final measurements, and some problems that can occur in forum discussions about potential timing reference problems. The FAQ lists many solutions found by users that experienced problems in the final verification.
It's common that MSO projects using measurements with a timing reference problem or some other measurement problem are nonetheless able to produce solutions that look very good "on paper" after optimization. This characteristic of MSO can lead to a false sense of security, and underscores the importance of doing a final measurement in REW to verify MSO's predictions.
You can make this verification process easier by performing your MSO measurements so the MLP is measured last as discussed earlier.
Some MSO Features to Help With Verification
To verify your results, you first configure your DSP processing with the desired filters and delays, then measure your system at the MLP with all subs energized at once. Then you export this measurement as a text file.
Importing Plot-Only Measurements
Downloading the User Guide Examples: The data for this demonstration are available as getting_started_user_guide.zip. To get results that match the examples, please download and unzip this file before beginning if you haven't already.
MSO has a text import feature specifically for helping with final measurement verification. You can invoke this feature in two ways.
- From the main menu, choose File, Import Plot-Only Measurements.
- In the Data View, locate the For Plotting Only node under Measurements. Right-click and choose Import Plot-Only Measurements.
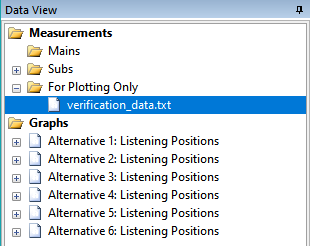
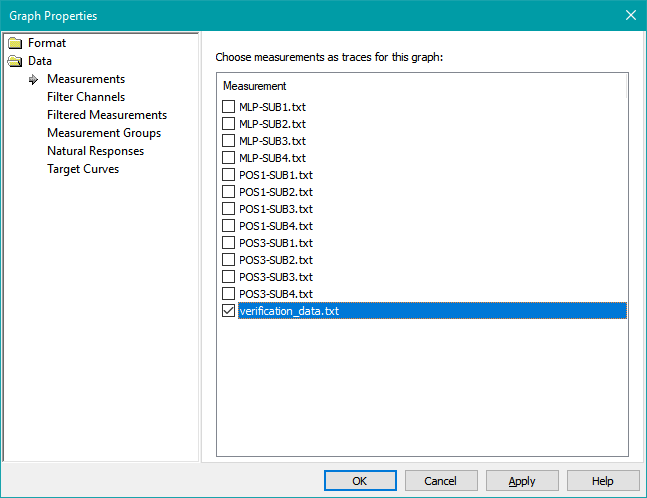
When you import a verification measurement in this way, the file name will show up in For Plotting Only node under Measurements as shown below.
Creating a Comparison Graph
The example we'll look at here is for illustration purposes. It makes use of the previous user-guide-8.msop example. Your data will of course be different.
Start by Cloning an Existing Graph
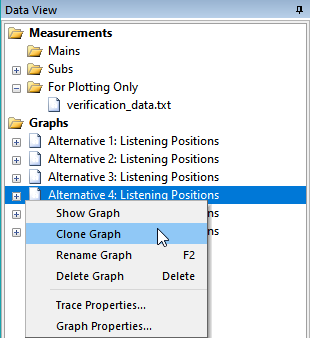
The simplest way to create a graph to compare MSO's predictions with the actual measured data is to start with a graph that already has a trace with the predicted MLP response and use the MSO Clone Graph feature. This is shown below for the Alternative 4: Listening Positions graph.
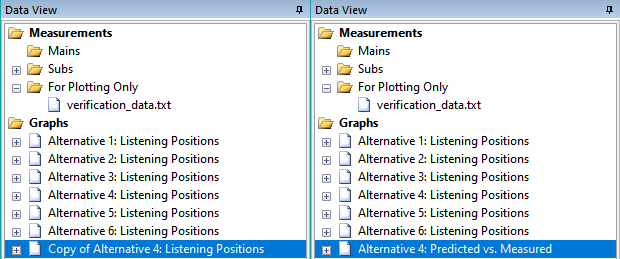
This creates a new graph called Copy of Alternative 4: Listening Positions. Select the name as shown below and press F2 to edit it. Change the name to Alternative 4: Predicted vs. Measured. The before and after conditions are shown below.
Remove Unwanted Traces From the New Graph
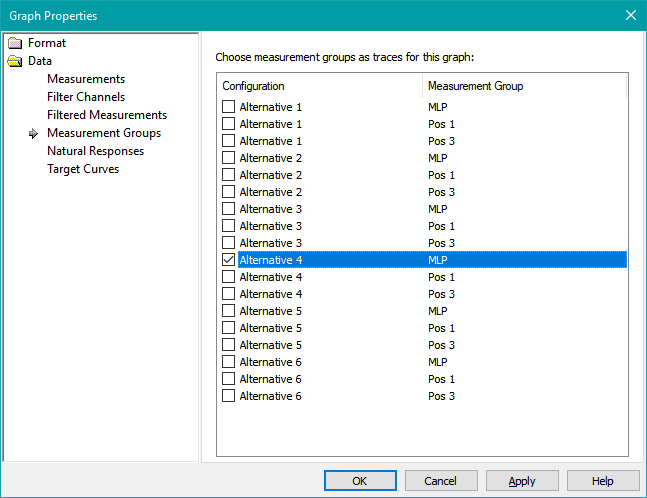
Next, bring up the graph's properties by selecting it and pressing Ctrl+G. Choose Measurement Groups under Trace Data Types. Uncheck all traces except the one for the MLP of the Alternative 4 configuration, then press Apply. The result is shown below.
Add the Verification Trace to the New Graph
Now choose Measurements under Trace Data Types. The verification_data.txt file that we imported will appear in the list as shown below.
Check its checkbox and click Apply. After clicking Apply, a new node representing this newly added trace will appear under Trace Properties. This is shown below.
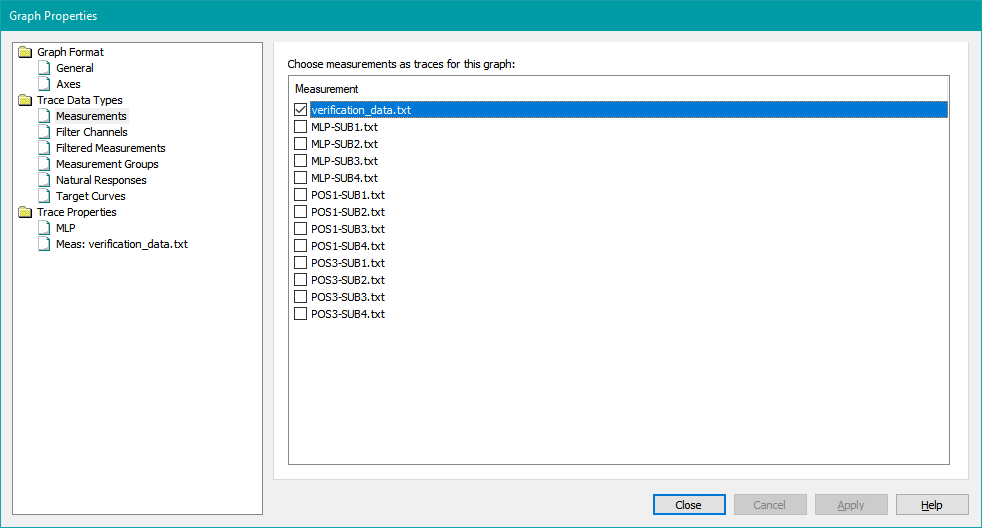
Now we have a graph containing only the two traces we wish to compare: the predicted and measured MLP responses. The scaling of the graph will be correct, since we obtained it by cloning an existing graph that already had the right scaling.
Give the Traces Descriptive Names
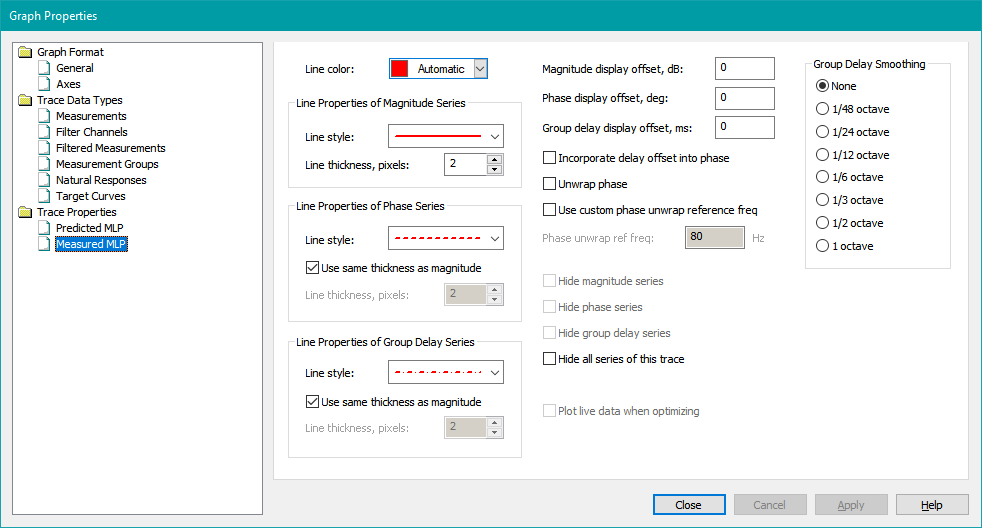
When adding graph traces, MSO's automatic trace naming usually doesn't name the traces exactly as we'd like. Let's fix that now. Under Trace Properties, select each trace and press F2 to edit its name. Rename MLP to Predicted MLP and Meas: verification_data.txt to Measured MLP. The result is shown below.
Give the Verification Trace an Offset if Needed
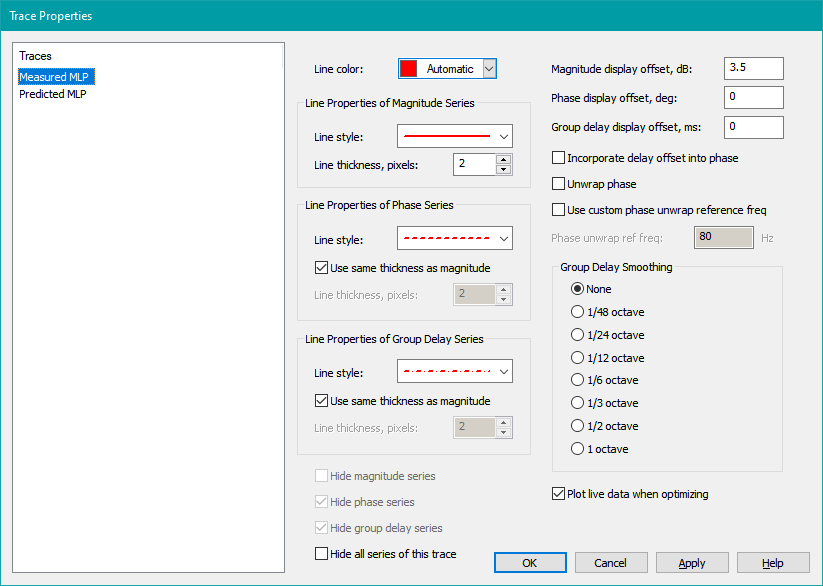
One potential need still arises: there could be a benign level difference between the measured and predicted data. To account for that, an offset can be added to the series representing the measured magnitude data. This is done directly using the property page of the Measured MLP trace shown above. The image below shows an added offset value of 3.5 dB to the Measured MLP series. This value is just chosen here as an example. For an actual verification, you'll want to try various offset values. As you enter different offsets, the new offset will immediately be detected and applied to the series. Thee is no need to press Apply for it to take effect. You can either enter the offset directly into the edit control, or use the spin button control to set it. Adjust the offset while observing the graph so that the measured trace with offset applied is as close as possible to being right on top of the predicted trace. The image below shows where this offset is entered.
Press Close when done to finalize the graph properties.
If the Predicted and Measured Results Don't Match
As discussed previously, troubleshooting this type of mismatch problem is difficult in online forums. Be sure to read the FAQ, as it lists many solutions found by users that experienced similar problems.